
Pipeline Funnel Visual
View the volume of subject members that are at or past different stages of a process.
The Pipeline Funnel visual shows the volume of subject members that are at or past different stages of a process. Subject members can be individual people (for example, applicants) or things (for example, requisitions).
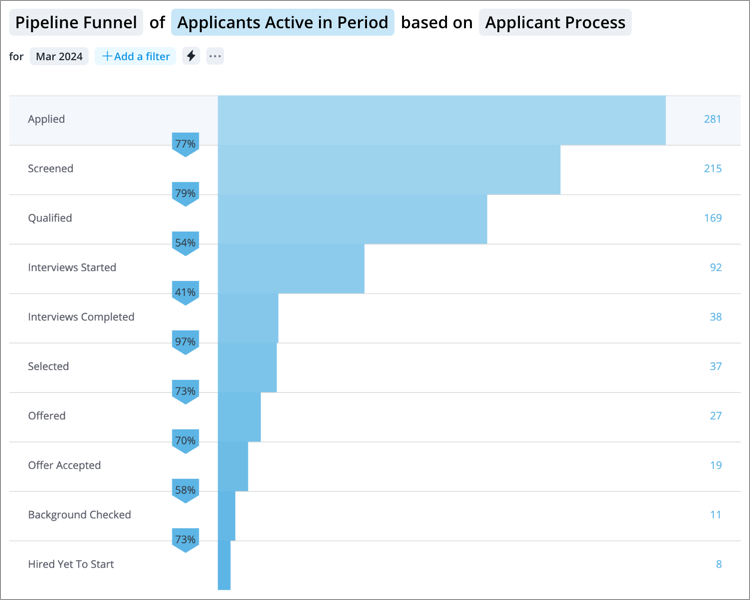
Each row on the chart represents a stage in the process. The stages are ordered sequentially with the start stage at the top of the funnel and the end stage at the bottom of the funnel. Each row contains:
- Stage name: The stages are customized to match organization processes.
- Subject Member Count: The number of subject members at or past the stage for the selected time period.
- Horizontal bar: The width of the bar is proportional to the size of the Subject Member Count.
The Stage to Stage Conversion Rates are shown on the left side of the chart. You can find a summary of the Success Ratio and Success Rate in the Insights tab of the Info panel.
Calculation Details
How the Subject Member Count is calculated
Subject members are counted in their current stage and any earlier stage in the process. For example, if a subject member is at Stage 3 for the selected time period, they are also included in the count for Stage 1 and Stage 2. Accurate Stage to Stage Conversion Rates can be calculated because subject members are counted in their current and past stages. This also allows the shape of the funnel to indicate the volumes that are required to deliver the outcome.
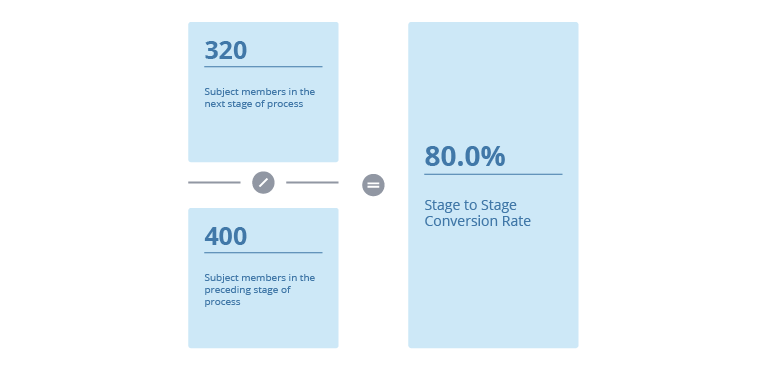
How the Stage to Stage Conversion Rate is calculated
The Stage to Stage Conversion Rate is the percentage of subject members who moved from one stage to the next calculated for the selected time period. It is calculated by dividing the number of subject members in the next stage by the number of subject members in the preceding stage.
For example, subject members, applicants in this example, move from the Applied stage to the Screened stage in the Applicant Process. Let's say, there are 400 applicants at or past the Applied stage and 320 applicants at or past the Screened stage, then the Applied Stage to Screened Stage Conversion Rate is calculated as follows:
How the Success Ratio is calculated
The overall Success Ratio shows the relationship between the number of subject members at the success stage of the process to the total number of subject members in the process. It represents how many subject members have yet to or failed to reach the success stage of the process for each successful subject member.
For example, the default success stage for the Applicant Process is Hired Yet to Start. Subject members, applicants in this example, are considered to be in the process if they are at or past the Applied stage. Let's say, there are 400 applicants at or past the Applied stage and 8 applicants are at the Hired Yet to Start stage, then the Success Ratio is calculated as follows:
Subject members at the success stage of process to Subject members in process = 8:400, reduced to 1:50.
This means that for each successful applicant that reaches the Hired Yet to Start stage there are fifty applicants that remain in the Applicant Process or have failed to reach the Hired Yet to Start stage.
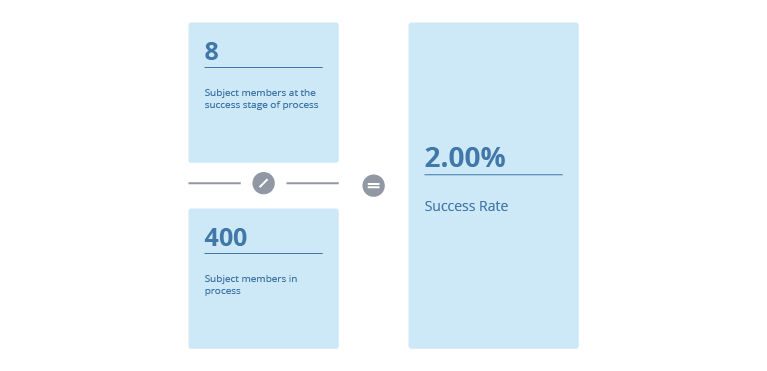
How the Success Rate is calculated
The overall Success Rate is calculated by dividing the number of subject members at the success stage of the process by the total number of subject members in the process.
For example, the default success stage for the Applicant Process is Hired Yet to Start. Subject members, applicants in this example, are considered to be in the process if they are at or past the Applied stage. Let's say, there are 400 applicants at or past the Applied stage and 8 applicants are at the Hired Yet to Start stage, then the Success Ratio is calculated as follows:
How to explore the visual to gain insight
- Look at the Subject Member Count for each stage to gauge the health of the process.
- Look at the Stage to Stage Conversion Rates to identify potential bottlenecks in the process.
- View the Success Ratio and Success Rate for each stage to see if there are enough subject members progressing through the process in a timely manner.
- View a list of subject members who are at or past a stage by selecting a chart item and clicking View details in the Insights tab of the Info panel.
- Compare the Stage to Stage Conversion Rates for different populations (for example, women and men) to identify differences in how they progress through the process.
Tip: Right-click on a chart item or data point to open the Visual Item Actions menu. Find actions that will allow you to quickly interact with points of interest. Actions include drilling up or down to view different levels of your data and accessing the Detailed View visual to see a list of subject members or event occurrences that make up a given population.